
Introduction
Cloud Computing is the century’s most exuberant technological innovation, driving critical business success criteria. Amazon Web Services (AWS) is a comprehensive and proven cloud service with the biggest market share. Amazon Web Services (AWS) monitoring is handled by using various tools and services to collect, analyze, and provide dashboards & reports for data insights. The insights in turn are useful in identifying vulnerabilities and issues, predicting performance, and ensuring good system health and high performance. Monitoring resources and services also help keep usage costs low by ensuring optimum resource usage, like using the right service, reducing underutilization, and taking advantage of reserve pricing.
Tech Vedika with its vast experience in application development and support leveraging the AWS cloud provides a complete solution for AWS Monitoring. This white paper provides an understanding of our AWS Monitoring Services, the features we provide, our best practices, and how we reduce overhead for our customers so that they can focus on their business while we monitor their AWS workloads. Intended readers for this whitepaper include IT/Cloud leaders in the enterprise.
AWS Monitoring Services Overview
Tech Vedika provides a broad portfolio of AWS Monitoring Services, supported by our AWS Monitoring framework and process, that is built and enhanced over years of experience. This complete set of monitoring offerings enables us to continuously deliver incremental value for our customers. To address the varying needs of customers who have different levels of maturity in their AWS Cloud journey, Tech Vedika AWS Monitoring Services offering provides focus on the following areas:
- Site Performance Monitoring
- Database Monitoring
- Storage Monitoring
- Virtual Machine Monitoring
- Virtual Network Monitoring
Monitoring Planning
It is essential for organizations using cloud services to have a plan for defining their monitoring strategy, identifying the monitoring tools and metrics, and implementing them. The following are the pre-requisites for building a successful monitoring plan.
- Define Monitoring Goals: List the goals of monitoring in terms of system health and performance.
- Capture the pain points: Define the pain points and areas that need improvement to further enhance the performance of AWS workloads
- Awareness of Tools: Identify in-house tools or employ a third-party tool with assistance from vendors who have a clear understanding of the monitoring tools
- Consensus: The stakeholders should understand and agree to the benefits AWS monitoring brings along for driving business value, customer satisfaction, and overall application performance
Monitoring Metrics
Before we start evaluating monitoring tools, it is important to define the key metrics for measuring system health and performance. The following are the core areas and metrics:
- Performance: These metrics include CPU Utilization, Memory Utilization, EngineCPUUtilization (for larger node types with 4vCPUs or more), Disk Utilization, Disk Capacity, Current Connections, Network Bandwidth, Status Checks, and Latency.
- Security: Security is a key area of monitoring. Organizations need insights to secure workloads. Possible threats include:
- Multiple instances that start/stop via programs
- Temporary security credentials that have long lives
- Activities that erase CloudTrail logs
- A new user account that deletes multiple users.
- Cost: While AWS provides automatic scalability and elasticity to the system, at the same time it needs continuous cost monitoring so that resource utilization is under control and within budget. The following are some hints to work in this direction:
- Resources to Requirements Mapping: Reduce the cost by stopping or resizing the low-utilization instances, databases, and other resources.
- Process to locate resource waste: Reduce the cost by snapshotting and deleting low-utilization EBS volumes and idle load-balancers. Leverage low-cost storage tiers for S3 infrequently accessed objects.
- Reliability: Logs and metrics should be used to monitor workloads and notify significant events and violations of thresholds.
Types of Monitoring
Monitoring an application deployed on the cloud requires monitoring at various levels. The following section provides an overview of the different monitoring types and metrics that need to be considered as part of a monitoring strategy.
- Site Performance Monitoring
- Network traffic, load-time, resource usage, and page availability.
- Impact of traffic and web elements on browsing performance.
- Inputs for SEO optimizations.
- Comparison with established KPIs.
- Database Monitoring
- Network throughput, client connections, I/O for read/write, burst credit balances for DB instances.
- High CPU/RAM/Disk space consumption, network traffic, DB connections, IOPS metrics.
- Storage Monitoring
- Enable remote storage monitoring
- Insights about storage volume layouts
- Detect inefficient capacities and processes.
- Detect security threats to proactive fixes.
- Virtual Machine Monitoring
- Capture the user activity and performance for organizations using cloud infra-services.
- Virtual Network Monitoring
- Monitor and protect firewalls, switches, routers, and software-based load-balancers.
- Assess network performance and point out the security issues.
AWS Monitoring Best Practices
The following are the proven best practices we utilize for our monitoring services:
- Specify Monitoring Goals: Organizations need to prioritize the mission-critical workloads and define the goals and alerts to meet these requirements first.
- Monitor Almost Everything: At times some ignored insignificant issues take a paramount shape and result in repercussions like business disruption.
- Automation is the key: Classic AWS implementations are huge and vigorous in terms of data and dynamics involved. Hence, it becomes difficult at the same time very vital to monitor each part. Here, automation comes in handy in accomplishing prolificacy at a lower cost.
- Start Simple: It becomes difficult to dig in everywhere. Evaluate the monitoring tools that best fit your needs.
- Adding Ownership using tags: To accomplish accountability with AWS monitoring, tag users who create instances in your company.
- Capture Logs: Logs help in keeping track of compliance and troubleshooting performance issues. Following are the important logs:
- Database Logs: To detect slow queries.
- Application Logs: Understand the reasons behind application failure.
- AWS CloudTrail Logs: To detect API calls made to the application.
- OS Logs: To identify host-failure reasons.
- Web Server Logs: To capture firewall logs and VPC logs for patterns of access and attacks.
- Budget Control: Command over the resources being employed assists in monitoring the cost and saving that extra penny.
Monitoring Tools Assessment
A well-monitored AWS workload does help in upgrading the functional conduct, scalability, agility, and security. It also brings along another gigantic engagement of monitoring a hefty system. Therefore, organizations should spend a good time accessing their requirements thoroughly. We use the following Checklist for assessment:
- How is the existing framework configured? This means is your present infrastructure on-premise, cloud, or hybrid. Further, how do you plan to monitor these? Do you want to employ a specific tool for each of these or a complete AWS monitoring system?
- Compliance Standards: What steps should be taken to comply with the governance and industry norms? Will just SaaS serve the purpose?
- Inventory Monitoring: Will the existing AWS monitoring system be enough to monitor your inventory or do you need a new tool for this?
- Replacing legacy with AWS: Price and complications involved in replacing any legacy solution with the new AWS monitoring system.
- Key Metrics: Does your organization have a clear understanding of the metrics involved in AWS monitoring?
Finding answers to the above questions will help in understanding the necessity of the AWS monitoring system and ranking the metrics.
Top AWS Monitoring Tools
TechVedika provides AWS Monitoring Services using AWS and proven 3rd party tools.

- Amazon CloudWatch: CloudWatch is a part of AWS, easily installable for on-premise, cloud, and hybrid models, and can help in real-time monitoring of the entire AWS application and infrastructure. It gathers operational and monitoring data like logs, metrics, and events. Automated Dashboards visualize this in a consolidated form to provide a united view of all the resources, services, and applications that run on your AWS application. Based on metric values or thresholds, abnormal application behavior can be monitored using alarms. This ensures a high-performing, healthy environment.
- One Platform: AWS CloudWatch provides data of all its resources, services, and applications on a single platform. This gives easy access and helps in correlating all the metrics, logs, and events.
- Metrics: AWS CloudWatch integrates more than 70 AWS services and provides a detailed 1-minute metric with up to 1-second granularity, to help in-depth analysis.
- Improve Performance and Utilization: Alarms help in identifying abnormal behavior hence corrective actions can be automated to check billing overages.
- Operational Insights: AWS CloudWatch provides automatic dashboards, real-time data insights, metric storage, and retention in a unified way that helps in optimizing resource utilization and system performance.
- Actionable Insights: Operational issues can be troubleshot with ease when users can visualize and explore logs. CloudWatch’s LogInsights scales with your log volume and complexity and provides answers in seconds. These logs can be correlated with metrics to have clear operational visibility.
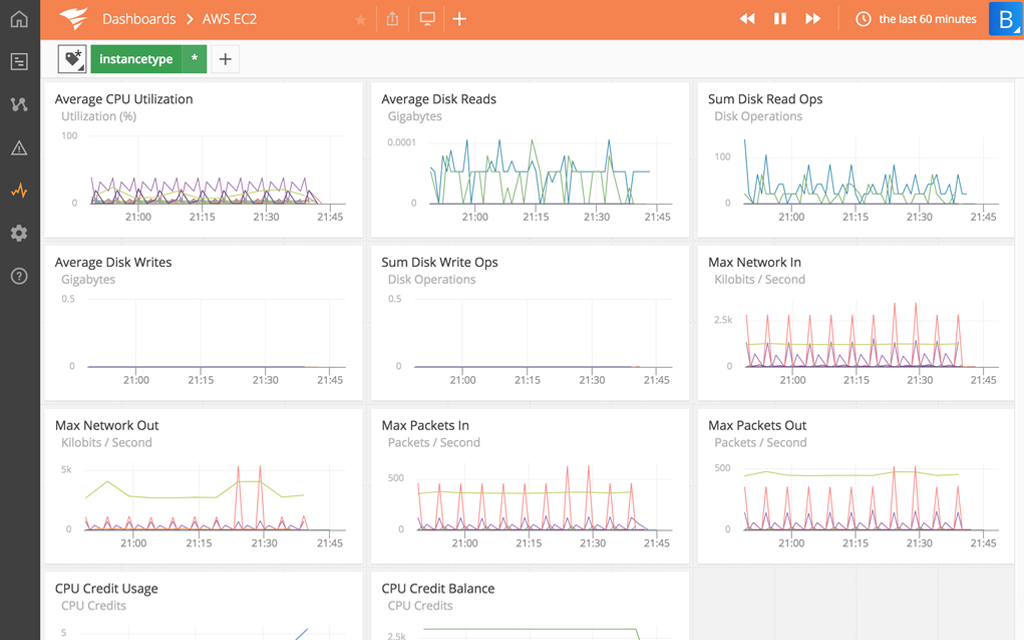
AWS Cloud Watch Dashboard
- New Relic APM: New Relic is a SaaS offering that focuses on AWS monitoring. It makes use of a standard Apdex (Application Performance Index) score to monitor your application performance throughout the AWS structure. It sends alerts about application downtime even before the end users get to know. Also, Relic provides its users with a list of most-time-consuming web transactions, and details of each thread to boil down to the root cause. It provides broad visibility across the entire AWS technology stack. Salient features include the following:
- Metrics and Map: Each application transaction can be broken down to analyze its performance. Also, the service map makes it easy to understand if the distributed applications and services are performing well. Histograms and other statistical tools aid better visualization.
- Monitoring: A detailed overview of database and application performance using threshold, error rate, and response-time, helps collect diagnostic information and minimize the impact on end-users.
- Performance Analysis: Analyzing thread activity, connection pools, class load/unload, history, and application performance helps reduce the issues. Also, the most time-consuming transactions can be identified.
AWS New Relic Dashboard

- AWS X-Ray: This is a user-centric, visual framework for collecting data about the requests made to your production and distributed applications. Great for debugging and analyzing. Data collected from individual services in the form of segments are aggregated, based on the common requests, into a single unit called trace. This trace in turn leads the way to individual requests as they pass through each layer of the application, hence helping in locating the pain point. Also, X-Ray processes these traces to generate service graphs, hence, improving the overall experience of the end-users.
X-Ray simplifies the process by:- Creating a service map – AWS X-Ray provides you with a map of the connection between the services used in your application. This helps in creating a dependency tree, detecting latency and errors across the entire AWS workload.
- Identifying errors and bugs – AWS X-Ray generates a response code for each request. This code can be analyzed to highlight bugs and errors without reproducing them.
- Analysis and visualization apps – A set of query APIs can be used to create user-specific analysis and visualization apps using the data from AWS X-Ray.
AWS X-Ray Dashboard
- Amazon EC2 Dashboard: EC2 monitoring tool is a service that helps to monitor and maintain Ec2 instances and infrastructure. EC2 Dashboard is useful for the following:
- Helps to view instance states and service health.
- Manage alarms and status reports.
- View scheduled events.
- Assess volume and instance metrics.

Amazon GuardDuty: Amazon GuardDuty is a threat detection service that continuously monitors your AWS accounts and workloads for malicious activity and delivers detailed security findings for visibility and remediation.
Tech Vedika provides the following services using AWS GuardDuty:
- Stop unauthorized activity
- Guard against the use of compromised credentials, unusual data access in Amazon Simple Storage Service (S3), API calls from known malicious IP addresses, and more.
- Enable continuous monitoring and analysis
- Gain insight into security events with findings that provide context, metadata, and details on impacted resources.
- Simplify forensics
- Quickly determine the root cause of suspicious activities
Conclusion
Tech Vedika is well-equipped to provide consulting and implementation services for AWS Monitoring with experts and tools for improving system health and performance to bring the best RoI from your cloud investments and experience. We are backed by our existing satisfied customers, who trust our quality of work and delivery. Leveraging extensive industry experience and a track record of proven delivery excellence, Tech Vedika brings the expertise and confidence enterprises need to effectively execute their AWS Monitoring strategy.